Back to Reports
Trends
Trends is a part of the Reports section designed for quick views of historical data over defined date ranges. The data looked at is Idling, Aggression and Speeding. Trends can either be view by Device or by Category. Device allows Trends for individual vehicles to be viewed and compared. Categories will do same between Categories of devices. This quite useful in checking for historical trends and habits within the vehicle fleet.

Trends are shown in either line graph form or in data. The client can choose which one they prefer to use.
There are three section within Trends:
Settings is where the parameters are set for the Trends to be viewed. It is here that you’ll toggle between Category and Device, set your date range and choose your topic.
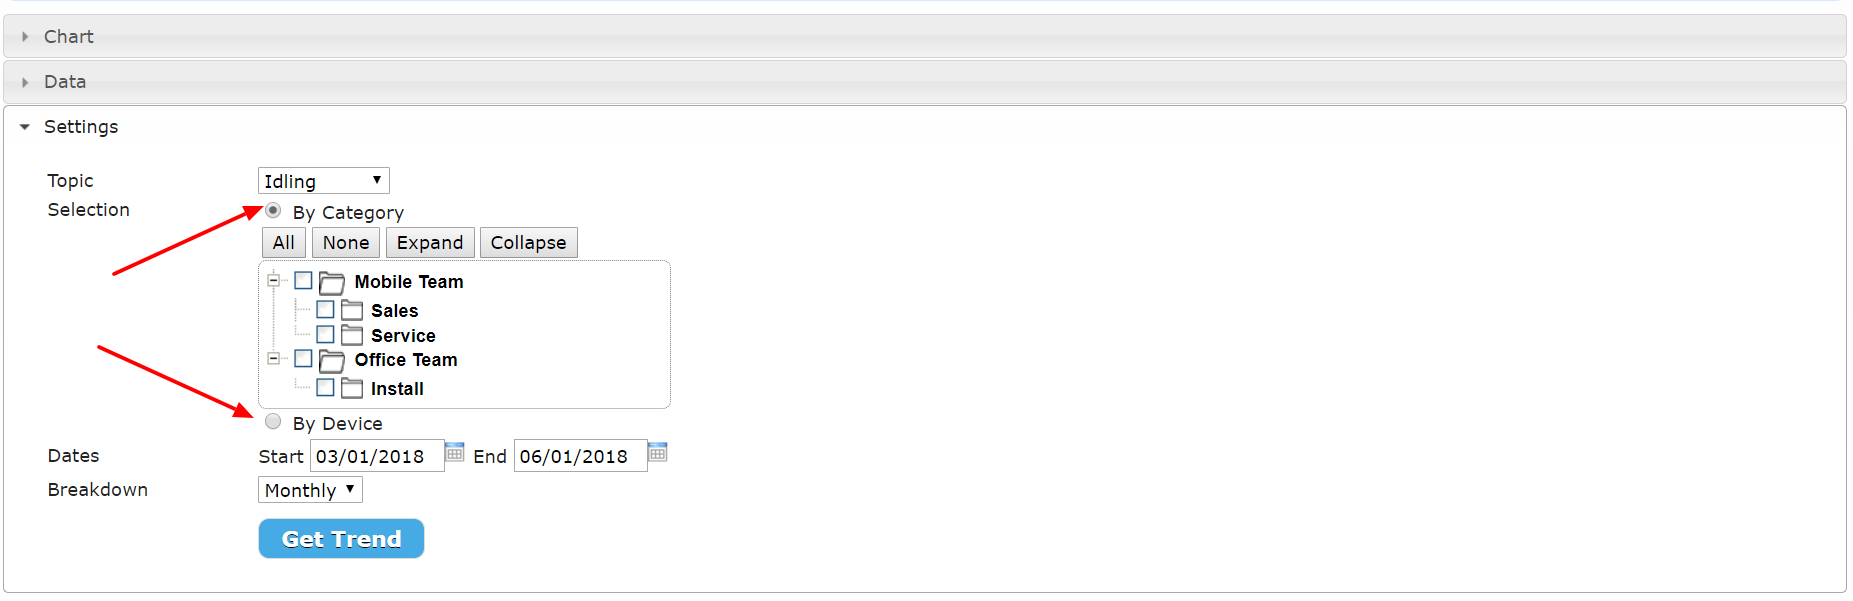
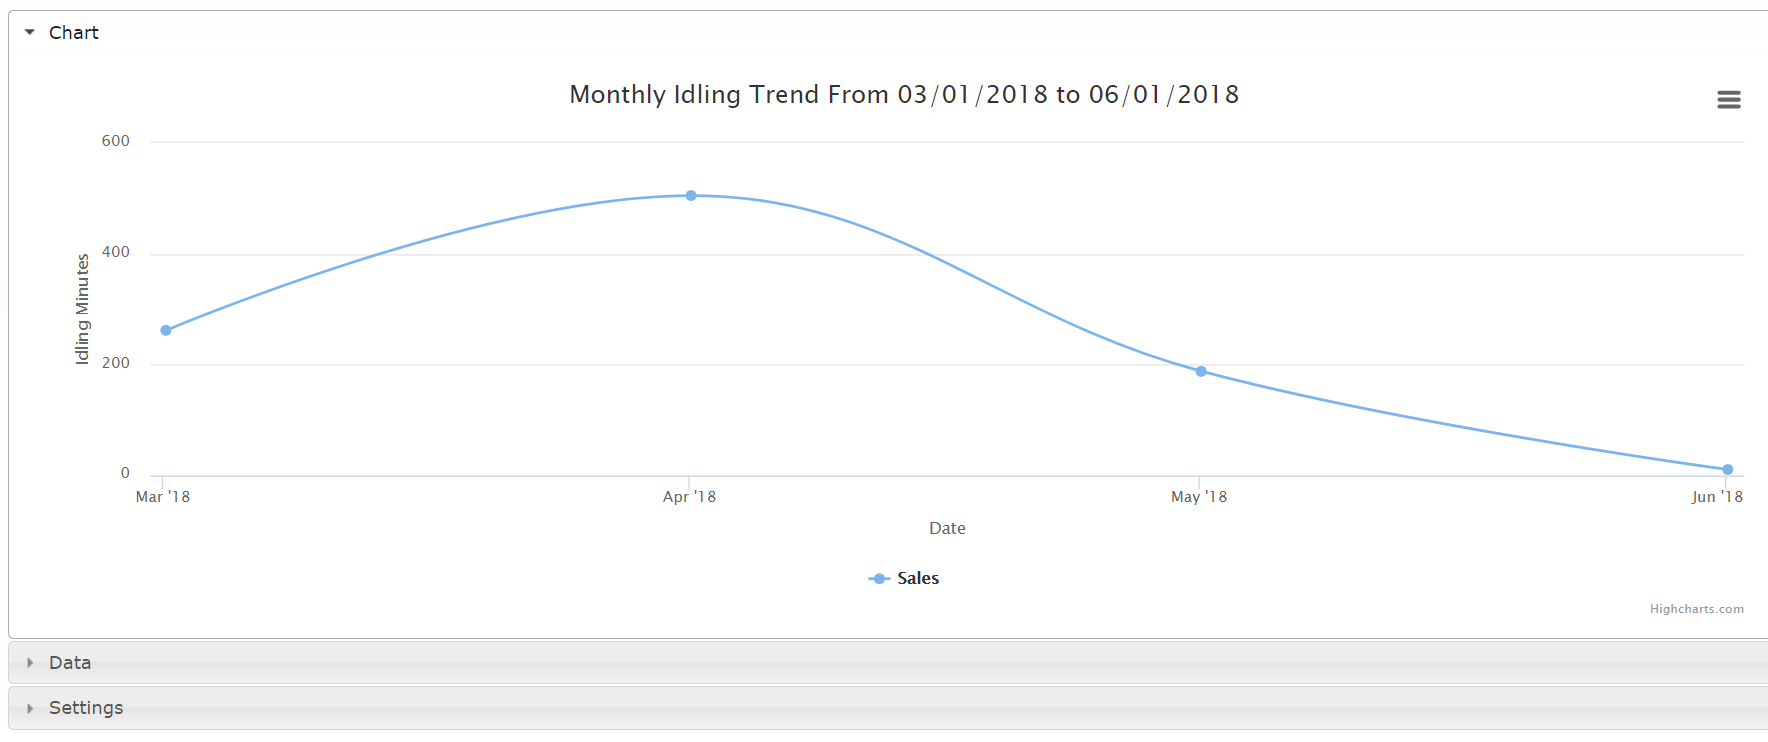
Chart will display the chosen data in form of line graphs.
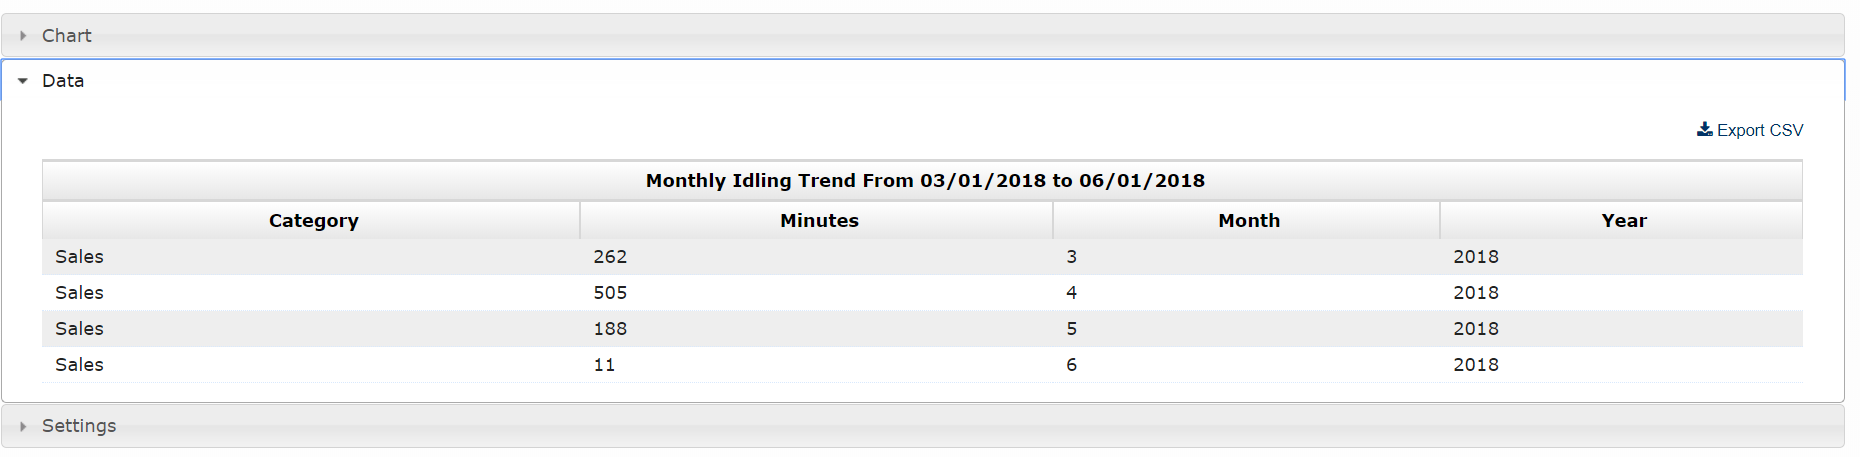
Data will display the chosen data as printed data.