Back to Platform Overview
Back to Dashboard
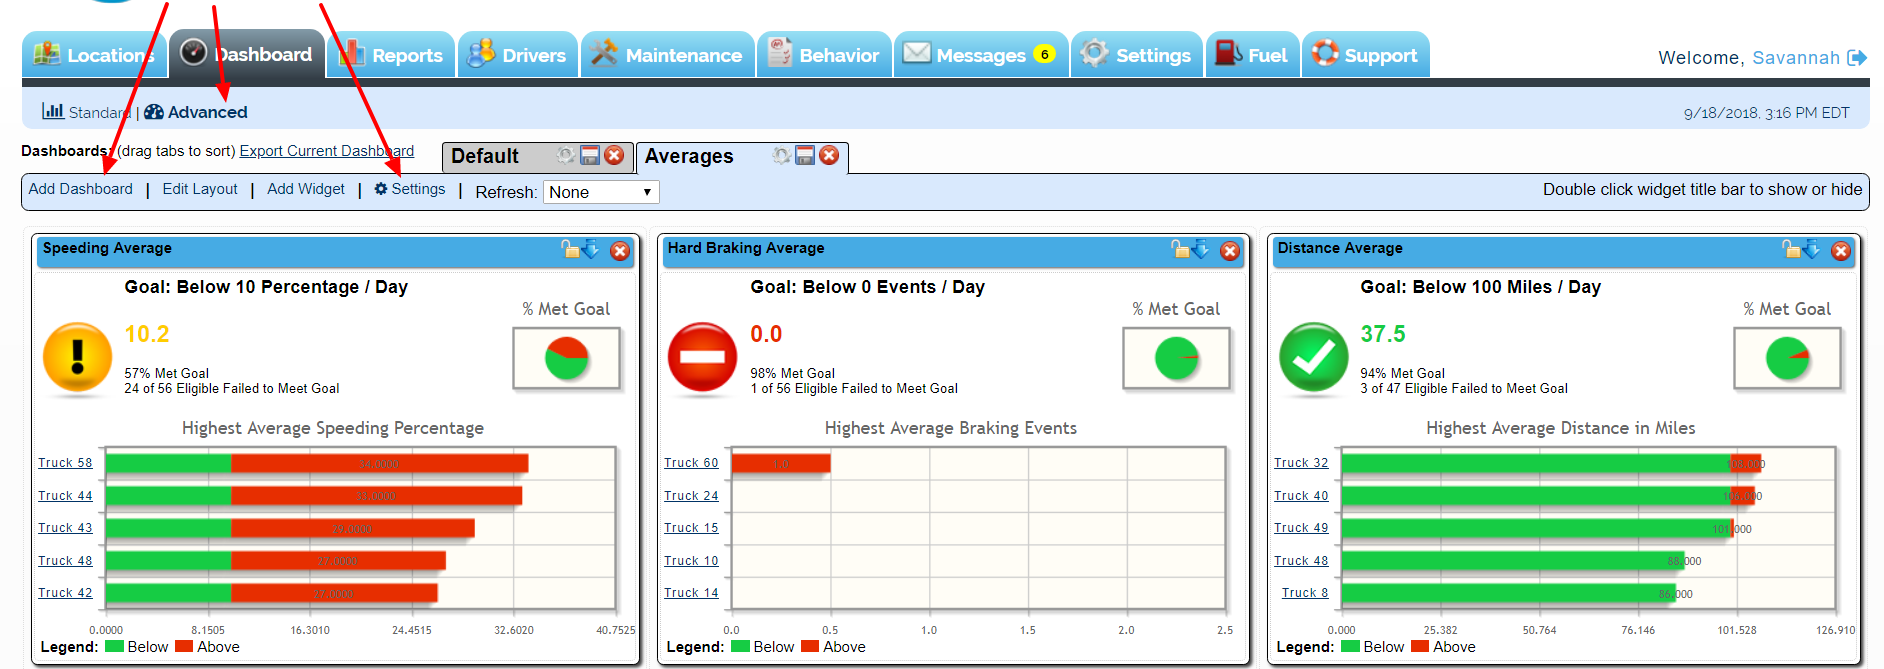
The Advanced dashboard consists of a series of widgets. The first set of widgets that are initially loaded onto your software platform function as placeholders and can be replaced with the widgets of your choosing.
To delete a widget, simply click on the red X in the upper right hand corner. Widgets can also be dragged and dropped, allowing you to customize the layout of the page. Click on the Lock icon in the upper right hand corner will freeze the widget in place, so that it cannot be moved until unlocked. Widgets can be added using the Add Widgets link. You can input your own Name for the widget, then select the widget Type and the Report Type (the data you want the widget to use). Select Add Widget to save. If you run out of room for Widgets, you can add another tab by selecting Add Dashboard.You can then use the new tab to build more widgets. The dashboards are a per User setting; each individual user can build their own widgets, which will not effect what the other users see. Use the link marked Settings to change which units and drivers are displayed on the widgets, along with the date range of data to use. This is also where you can input the goals needed for the Average widgets. Be sure to hit “Refresh Reports and “Done” to save the changes.
Below, you can see samples of each type of widget:
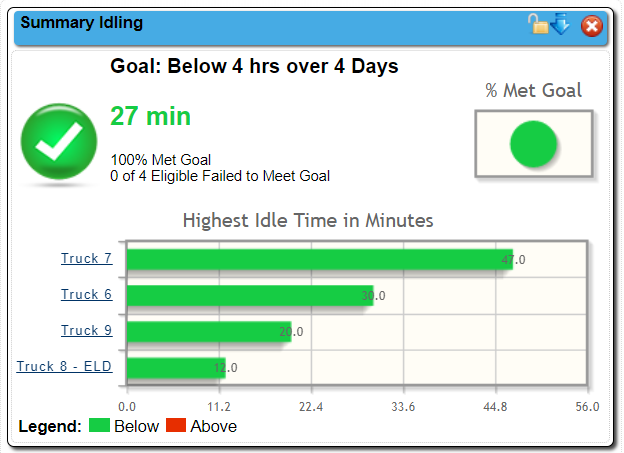
Summary
This widget is a variant of the Average widget seen further down the page. It allows the User to see the set Goal in larger terms. For example: stating that a vehicle can have an average of less than 4 hours Idle time over 4 days, versus a regular Average widget which sets the goal day-by-day (under 4 hours of Idle on average per day)
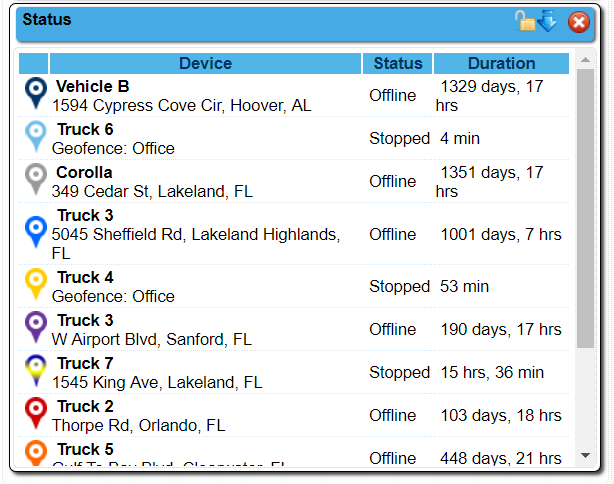
Status
This widget lists the vehicles on the platform, their current location, vehicle status and the duration of the current status
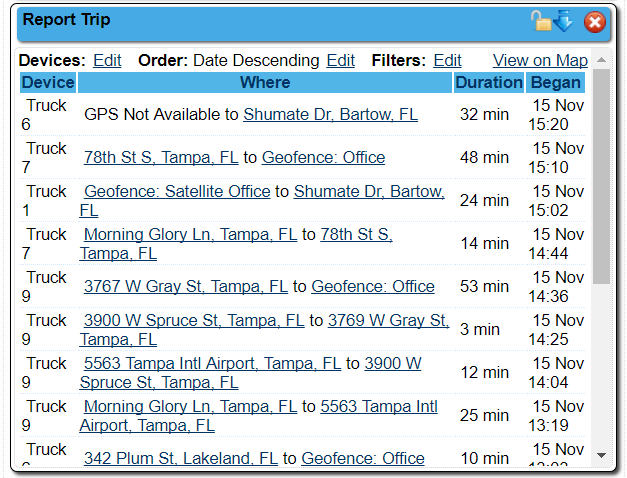
Report
The widget will let you see a list of the selected events within the date rage specified. The example below is listing Trips.
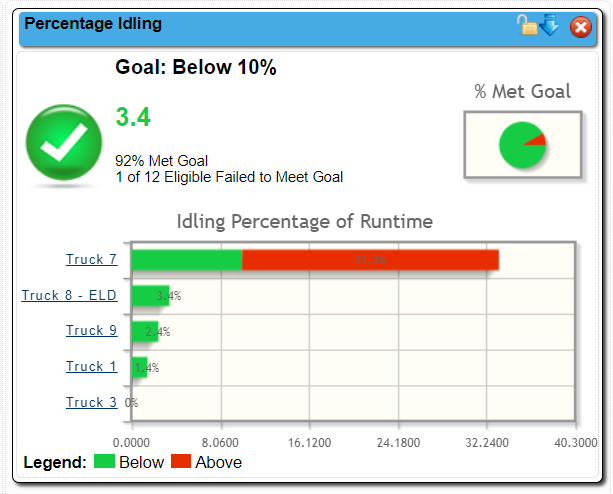
Percentage
This widget is specifically designed to look at the follow three data points: Idle Time, Speeding and Seatbelt Use. A goal is set by the User in the Settings link at the top of the page and the resulting chart shows if the selected item has met the goal (or not). The example show is looking at Idling
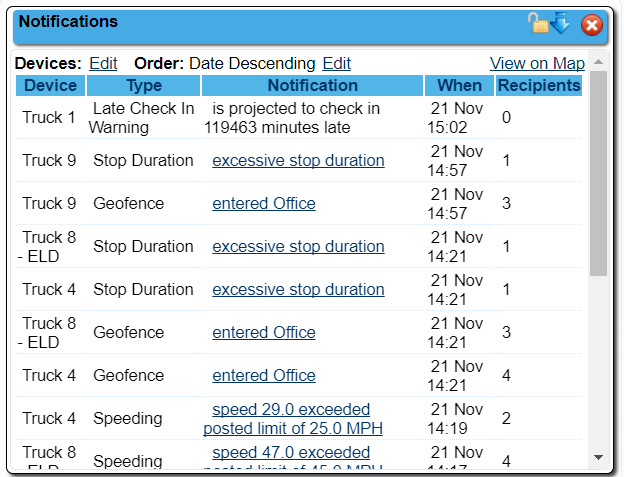
Notifications
This widget provides a list of triggered Alerts for the date range specified. It’s a version of the Notifications report.
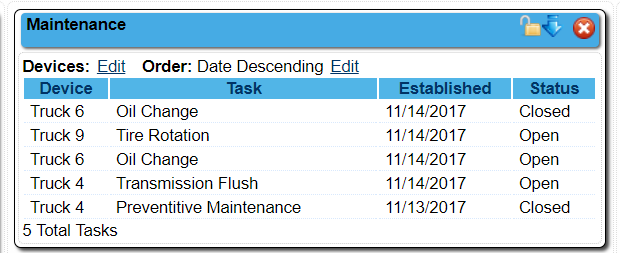
Maintenance
A list of all Maintenance tasks within the date range, both open and closed.
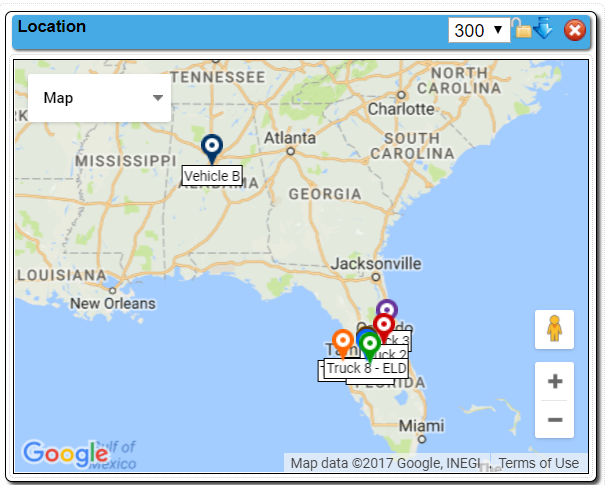
Location
A smaller version of the map on the Locations tab. Allows the User to see their vehicle locations while within the Dashboard.
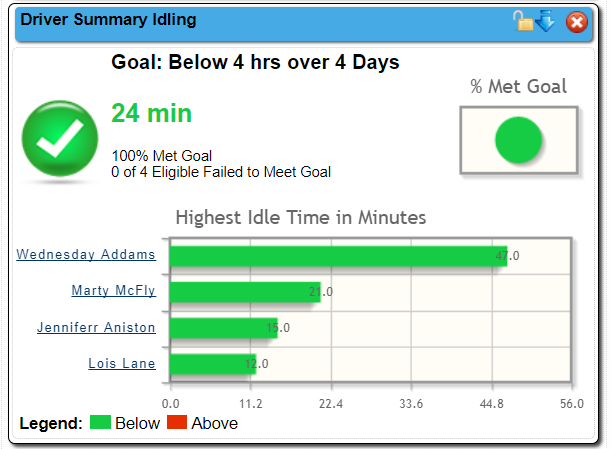
Driver Summary
This widget is a variant of the Average widget seen further down the page, looking at a Driver instead of a Device. It allows the User to see the set Goal in larger terms. For example: stating that a vehicle can have an average of less than 4 hours Idle time over 4 days, versus a regular Average widget which sets the goal day-by-day (under 4 hours of Idle on average per day)
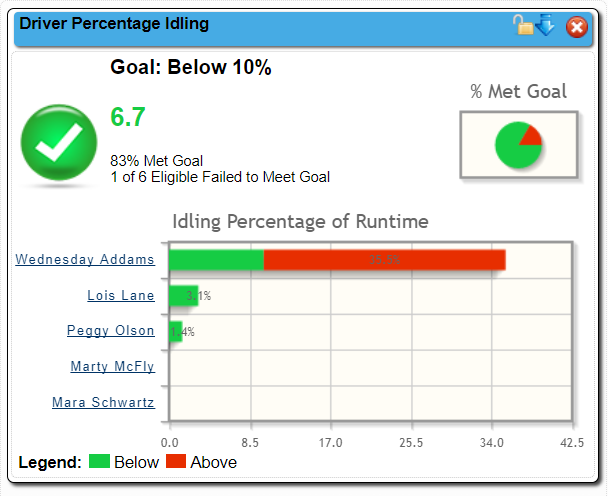
Driver Percentage
This widget is specifically designed to look at the follow three data points: Idle Time, Speeding and Seatbelt Use for a Driver instead of a Device. A goal is set by the User in the Settings link at the top of the page and the resulting chart shows if the selected item has met the goal (or not). The example show is looking at Idling
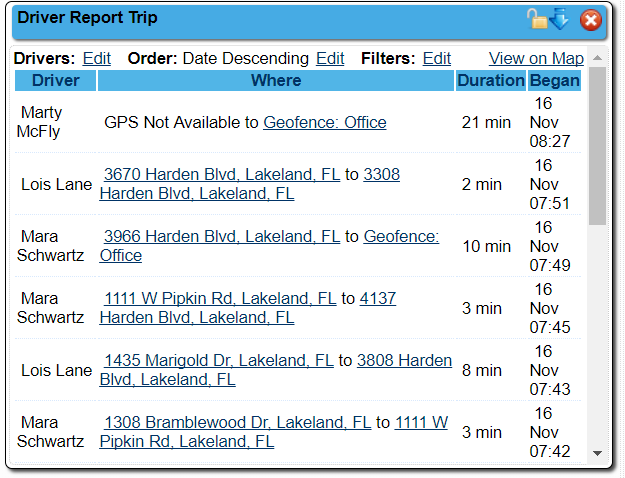
Driver Report
The widget will let you see a list of the selected events within the date rage specified for a Driver instead of a Device. The example below is listing Trips.
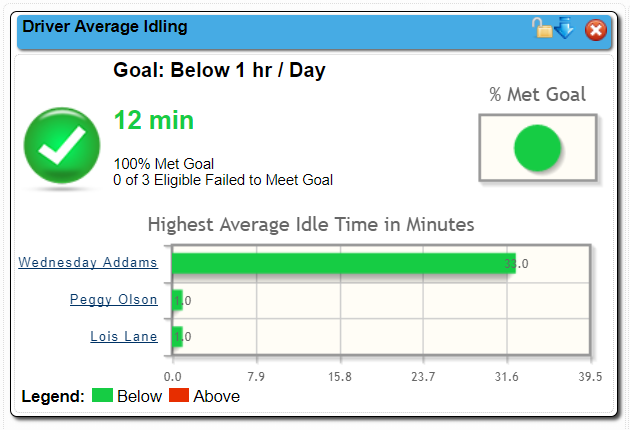
Driver Average
This widget takes a particular Driver behavior (example below is Idle time) and allows the User to set a goal for the behavior. The resulting chart shows which vehicles have met the goal and which ones haven’t
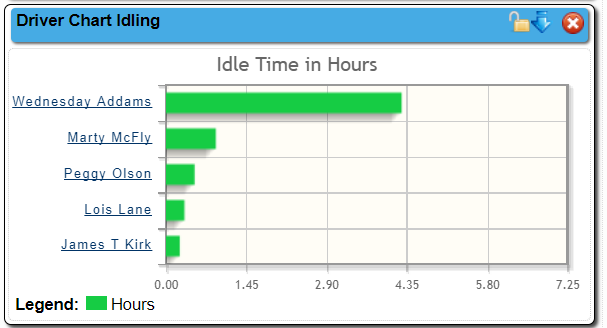
Driver Chart
A very basic widget that allows the User to see a quick comparison between Drivers regarding the behavior item chosen (this example is looking at Idle time).
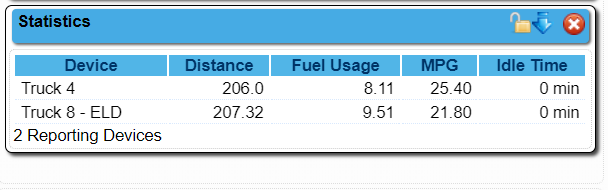
Statistics
This widget is only going to show data for devices that pulling Sensor Data from the vehicle. The widget will list each unit along with their mileage, fuel usage, mpg and idle time for the date range selected.
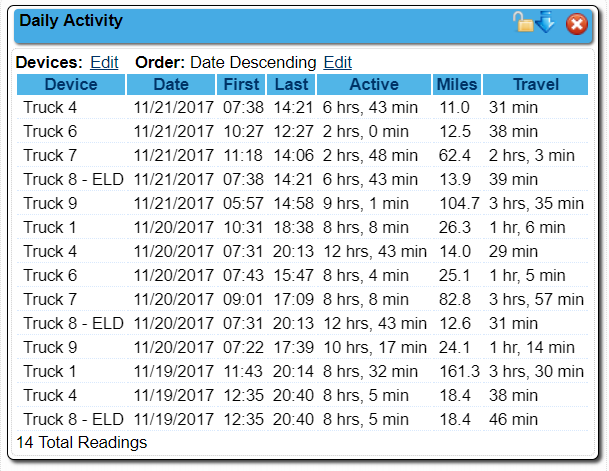
Daily Activity
A variant of the Activity report, this widget breaks down travel data activity point by activity point for the selected vehicle within the selected date range
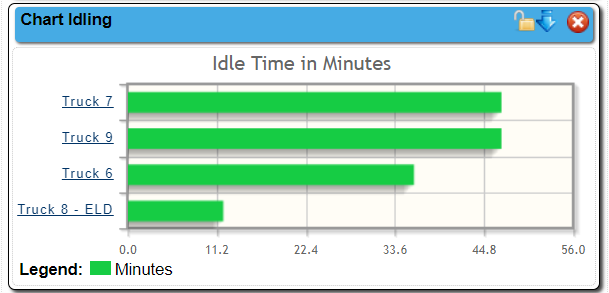
Chart
A very basic widget that allows the User to see a quick comparison between Devices regarding the behavior item chosen (this example is looking at Idle time).
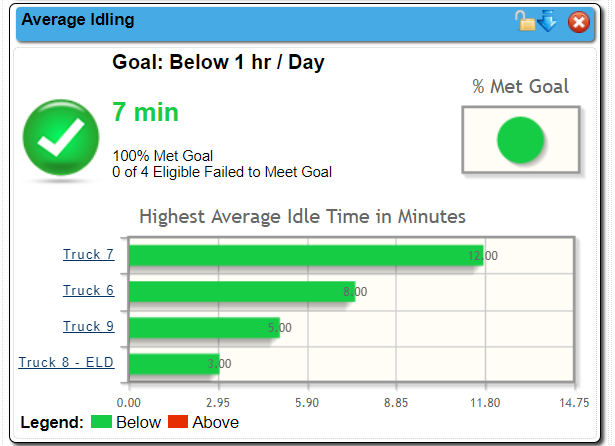
Average
This widget takes a particular Device behavior (example below is Idle time) and allows the User to set a goal for the behavior. The resulting chart shows which vehicles have met the goal and which ones haven’t